If you are trading the spot market (equities, forex, or crypto) without looking at the options derivatives market, you are driving with one eye closed. Today’s markets are increasingly driven by the "tail wagging the dog"—where options positioning dictates the movement of the underlying asset.
One of the most powerful ways to exploit this dynamic is by combining Options Greeks with Mean Reversion strategies. By understanding how market makers and large dealers hedge their massive options portfolios, retail and institutional traders alike can identify high-probability signals for when an overextended spot price is about to snap back to its mean.
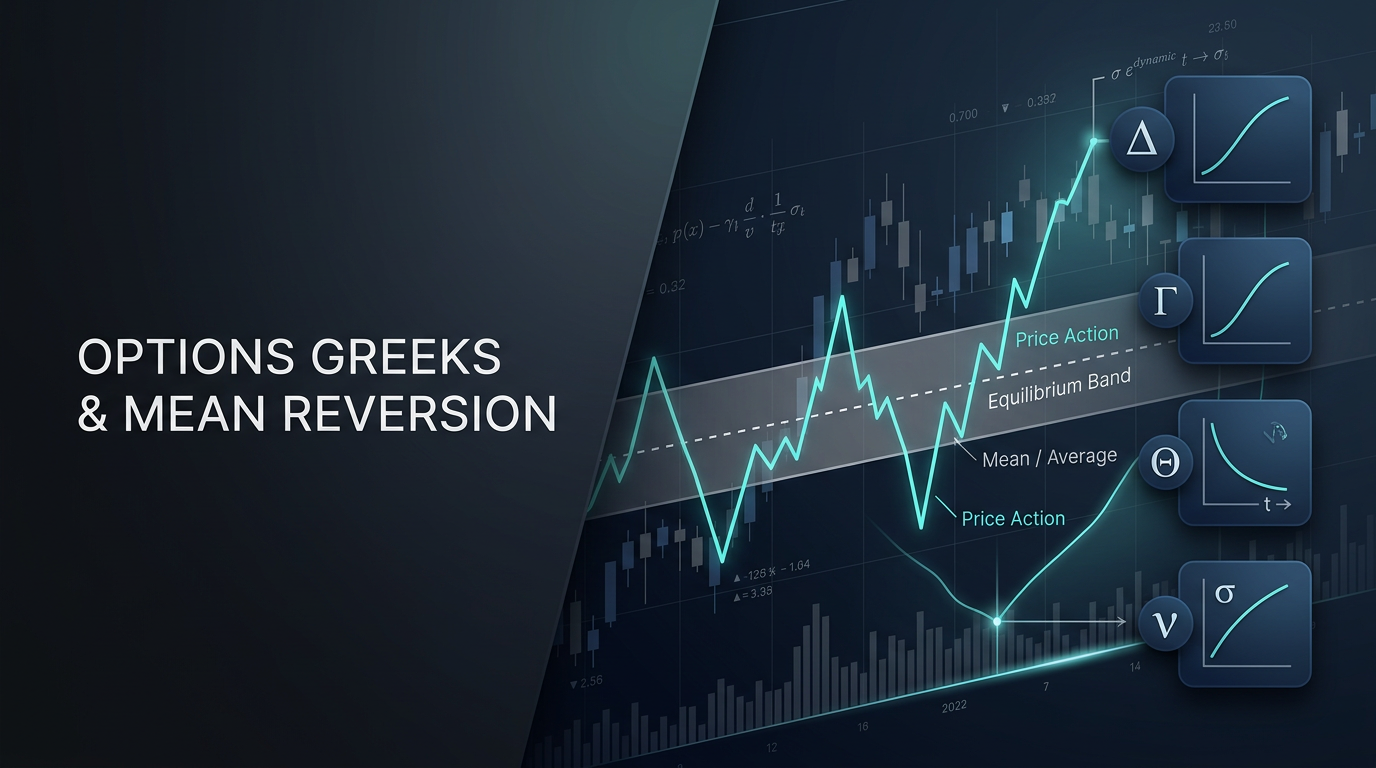
In this deep dive, we will explore how to translate complex Greek data into actionable spot signals, focusing on the mechanics that force price reversals.
What is Mean Reversion?
At its core, mean reversion is a financial theory positing that asset prices, volatility, and historical returns eventually return to their long-term mean or average level. When an asset price stretches too far in one direction—like a rubber band—it accumulates tension. Mean reversion traders look for the exact moment that tension releases, snapping the price back to its baseline.
While traditional mean reversion relies on technical indicators like Bollinger Bands or RSI, modern order-flow traders look under the hood at Options Greeks.
The Core Concept: Dealer Hedging and Market Gravity
To understand Greek-based spot signals, you must understand the "Market Maker." When retail and institutional traders buy options, market makers are usually taking the other side of that trade. Because market makers want to profit from the spread and avoid directional risk, they constantly buy and sell the underlying asset (spot) to remain "Delta Neutral."
This continuous buying and selling creates invisible boundaries in the market. Depending on the overall options positioning, market makers will either act as a dampener on volatility (creating mean reversion) or an accelerant (creating trends).
Here is how the specific Greeks provide signals for mean reversion:
1 Gamma Exposure (GEX): The Ultimate Mean Reversion Magnet
Gamma measures the rate of change in Delta for every $1 move in the underlying asset. For spot traders, aggregate Gamma Exposure (GEX) is the single most important metric to track.
Positive GEX Environment (High Mean Reversion): When market makers are net-long Gamma, they must sell the underlying asset as it goes up, and buy it as it goes down to remain delta-neutral. This creates massive liquidity walls. If the spot price pushes up, dealer selling pushes it back down. If it drops, dealer buying props it up.
The Signal: In a high positive GEX environment, traditional breakout strategies will fail. This is the optimal environment for mean reversion. Look to fade the extremes (short the rallies, buy the dips) because dealer hedging is actively fighting the trend.
2 Delta Skew: Spotting The Extreme Rubber Band
Delta measures an option's sensitivity to the price of the underlying asset. By looking at the Delta Skew (the difference in implied volatility and pricing between Out-Of-The-Money Calls and Out-Of-The-Money Puts), you can gauge market sentiment and positioning.
The Signal: When Delta Skew reaches historic extremes—for example, if traders are panic-buying OTM puts to protect their portfolios, driving put premiums into the stratosphere—it often signals exhaustion. Once the catalyst for the panic passes, the demand for puts evaporates. As market makers unwind their short-spot hedges, it triggers a violent "short covering" rally, reverting the spot price aggressively back to the upside.
3 Vanna: The Volatility-Driven Reversal
Vanna is a second-order Greek that measures the change in Delta relative to a change in Implied Volatility (IV). It tells us how market makers have to adjust their spot hedges when volatility spikes or crushes.
The Mechanics: Let's say the market experiences a sudden drop, and Implied Volatility spikes. If market makers have negative Vanna exposure, this IV spike forces them to short the underlying asset, exacerbating the drop.
The Signal: The mean reversion signal triggers when IV peaks and begins to crush (often after an event, like an earnings call or macroeconomic data release). As IV drops, the Vanna effect reverses. Dealers are forced to buy back the underlying asset they shorted, causing a swift mean reversion rally in the spot price.
4 Charm: The Silent Time-Decay Squeeze
Charm (also known as Delta Decay) measures how Delta changes as time passes and we get closer to the option's expiration (usually related to Theta).
The Mechanics: As options approach expiration, OTM options lose their Delta rapidly, while In-The-Money (ITM) options see their Delta move toward 1.0 (or -1.0 for puts).
The Signal: Towards the end of the week or month (specifically around "OpEx" or Options Expiration days), Charm flows become incredibly powerful. If dealers are holding hedges for millions of OTM put options, and those options begin to decay to zero as Friday approaches, dealers must buy back the spot asset to un-hedge. This creates a predictable upward drift or mean reversion into the end of the week, entirely driven by the passage of time.
Building a Greek-Based Mean Reversion Strategy
Ready to put this into practice? Here is a blueprint for integrating these concepts into your spot trading strategy:
- Map the Gamma Levels: Before the trading session begins, identify the largest Call Gamma and Put Gamma strikes. These act as your extreme support and resistance zones.
- Determine the GEX Regime: Are we in Positive GEX or Negative GEX? If Positive GEX, deploy your mean reversion strategies (RSI divergence, fading Bollinger Bands) at the key Gamma levels.
- Watch the VIX / Volatility: If the spot price is dropping into a heavy Put Gamma wall, watch for a peak in volatility. The moment volatility stops rising and begins to crush, look for a long entry. Vanna flows will fuel your mean reversion trade.
- Time Your Entries Around OpEx: Be highly aware of OpEx weeks. Mean reversion signals are exponentially stronger when Charm flows are forcing dealers to unwind hedges.
The Bottom Line
Trading spot without understanding options positioning is a massive disadvantage. The Options Greeks—specifically aggregate Gamma, Vanna, and Charm—reveal the hidden mechanical forces driving market gravity.
By identifying environments where dealer hedging creates friction (Positive GEX) and timing your entries with volatility crushes (Vanna) or time decay (Charm), you can transform standard mean reversion setups into high-probability, structural market anomalies.